
View an Endpoints Data usage
The data usage summary shows aggregated data consumption across the endpoint in your account.
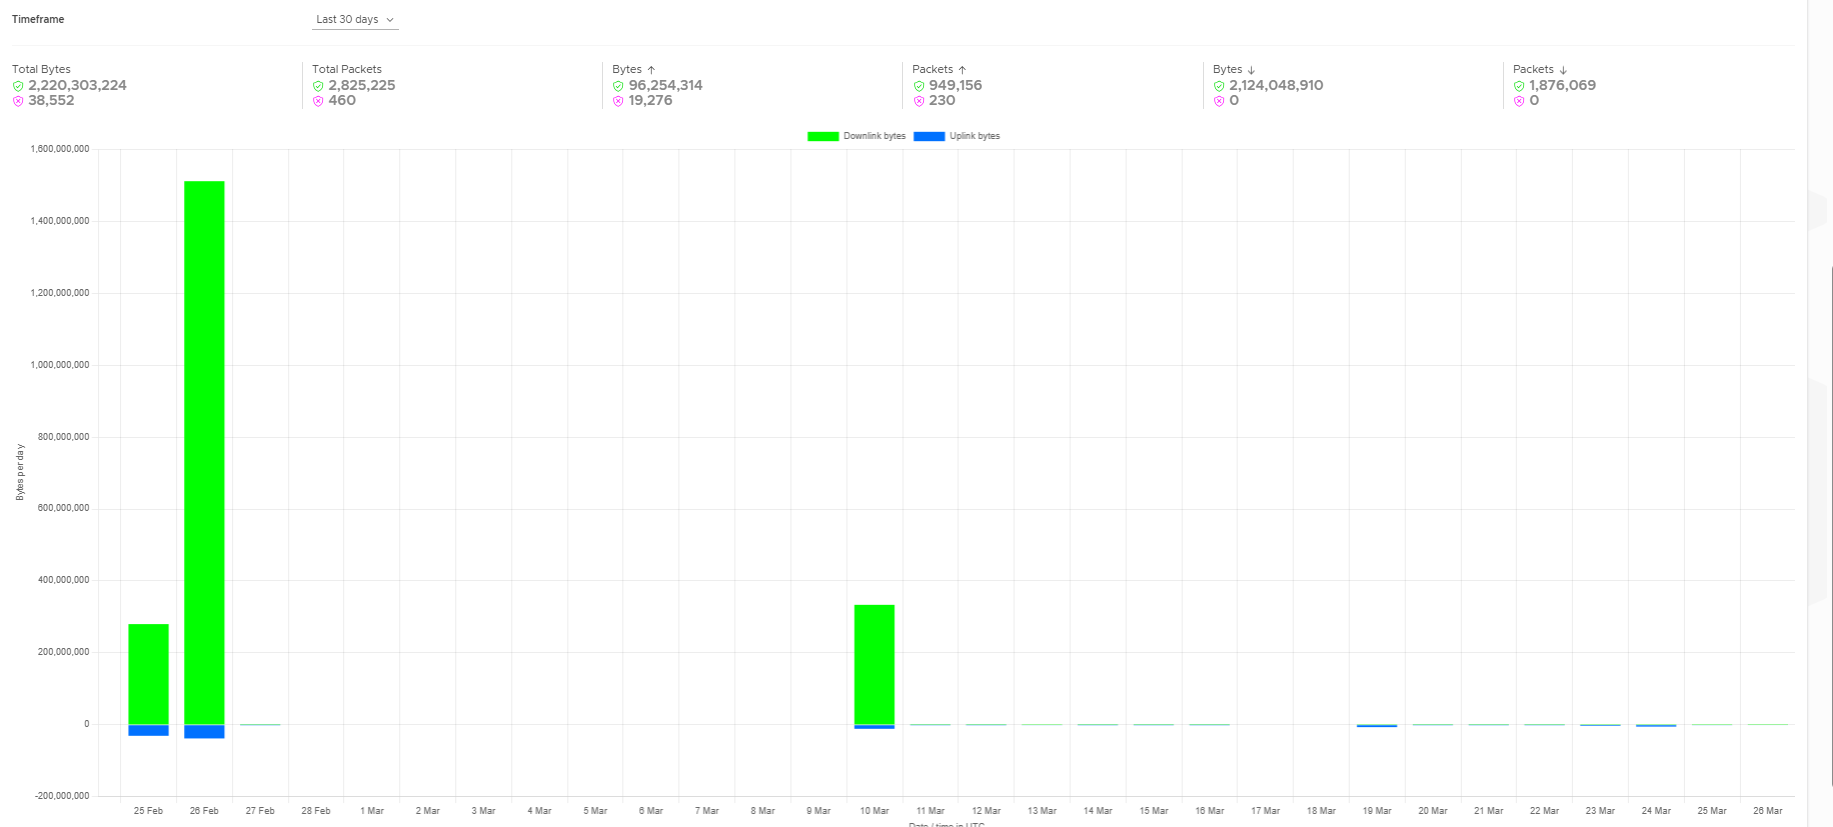
Six metrics are displayed above the chart:
- Total Bytes and Total Packets -- combined totals across all traffic
- Bytes (uplink) and Packets (uplink)-- data transmitted from endpoints
- Bytes (downlink) and Packets (downlink)-- data received by endpoints
Each metric displays two values.
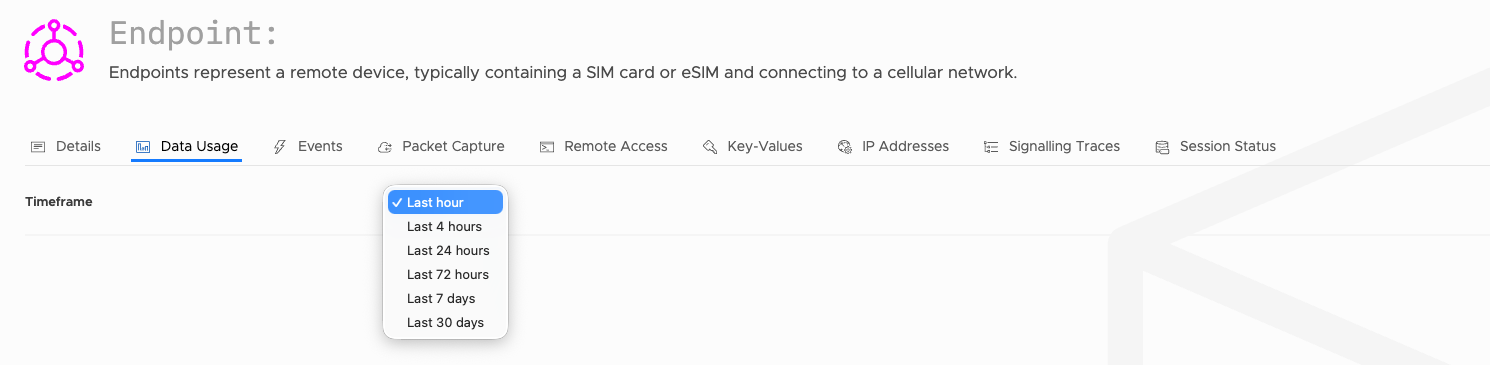
The bar chart plots bytes per day, with downlink bytes shown in green and uplink bytes in blue. Use the Timeframe dropdown to adjust the reporting window - options include Last 7 days and Last 30 days.
Updated 4 months ago
What’s Next
Did this page help you?