
Finding your way around
The below header bar runs across the top of every page in the Stacuity Customer Portal and provides access to key controls.

The Stacuity Logo
Clicking the Stacuity logo in the top left returns you to the Dashboard from anywhere in the portal.
Your Account Name
The button showing your account name (for example, "Test Customer") tells you which customer account you are currently viewing. If you are a tenant administrator and viewing the portal on your client's behalf, you will see an impersonation icon next to the account name.
Credit Balance
The top right hand side of the navigation bar shows your current account balance (for example, £19.80). This balance is managed in collaboration with your Tenant, who will have already discussed the account setup and management process with you. The button only turns amber once the amount falls within the your warning limit.
If additional credit is required, please contact your Tenant to arrange an increase.
Your balance updates in real time as your endpoints consume data. If the balance reaches zero, your endpoints may lose the ability to initiate new data sessions.
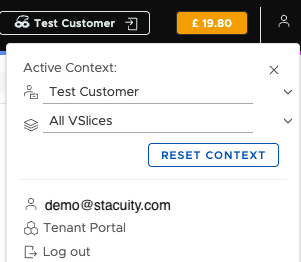
User Menu
Clicking the person icon in the top right opens a dropdown with the following:
Active Context shows which customer account and VSlice filter are currently active. Use the dropdowns to switch context if you have access to multiple accounts or to filter the portal view to a specific VSlice. Click Reset Context to return to the default view showing all VSlices.
Your email address confirms which user account you are logged in as.
Tenant Portal switches you to the Stacuity Tenant Portal if your organisation has access to it. This is a separate interface used for managing customers, tariffs, and sub-tenants.
VSlice Filter Allows you to quickly filter and work with a selected VSlice. This can be reset to All VSlices very quickly.
Log out ends your session and returns you to the login screen.
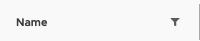
Filtering
Some column headers have a filter icon. Click it to type a filter value for that column. Filters are case-sensitive, so "fleet" and "Fleet" will return different results. Multiple filters can be active at the same time and work together to narrow the list down further.
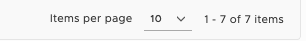
Pagination
The bottom of every list shows the total number of items and the current page. Use the Items per page dropdown to control how many records are shown at once. The counter (for example, "1 - 7 of 7 items") confirms how many records match your current filters.
Manage Columns
Click Manage Columns at the bottom left of any list to choose which columns are visible. Check or uncheck columns to show or hide them. This is particularly useful for troubleshooting—for example, showing the Routing Policy or Regional Policy column lets you quickly spot if an endpoint has an unexpected configuration without opening each record individually.
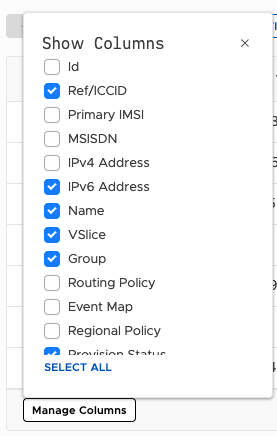
Click Select All to enable every column at once.
Updated 4 months ago