
Endpoint Signalling traces
This view provides access to control-plane network signalling data for troubleshooting and analysis.
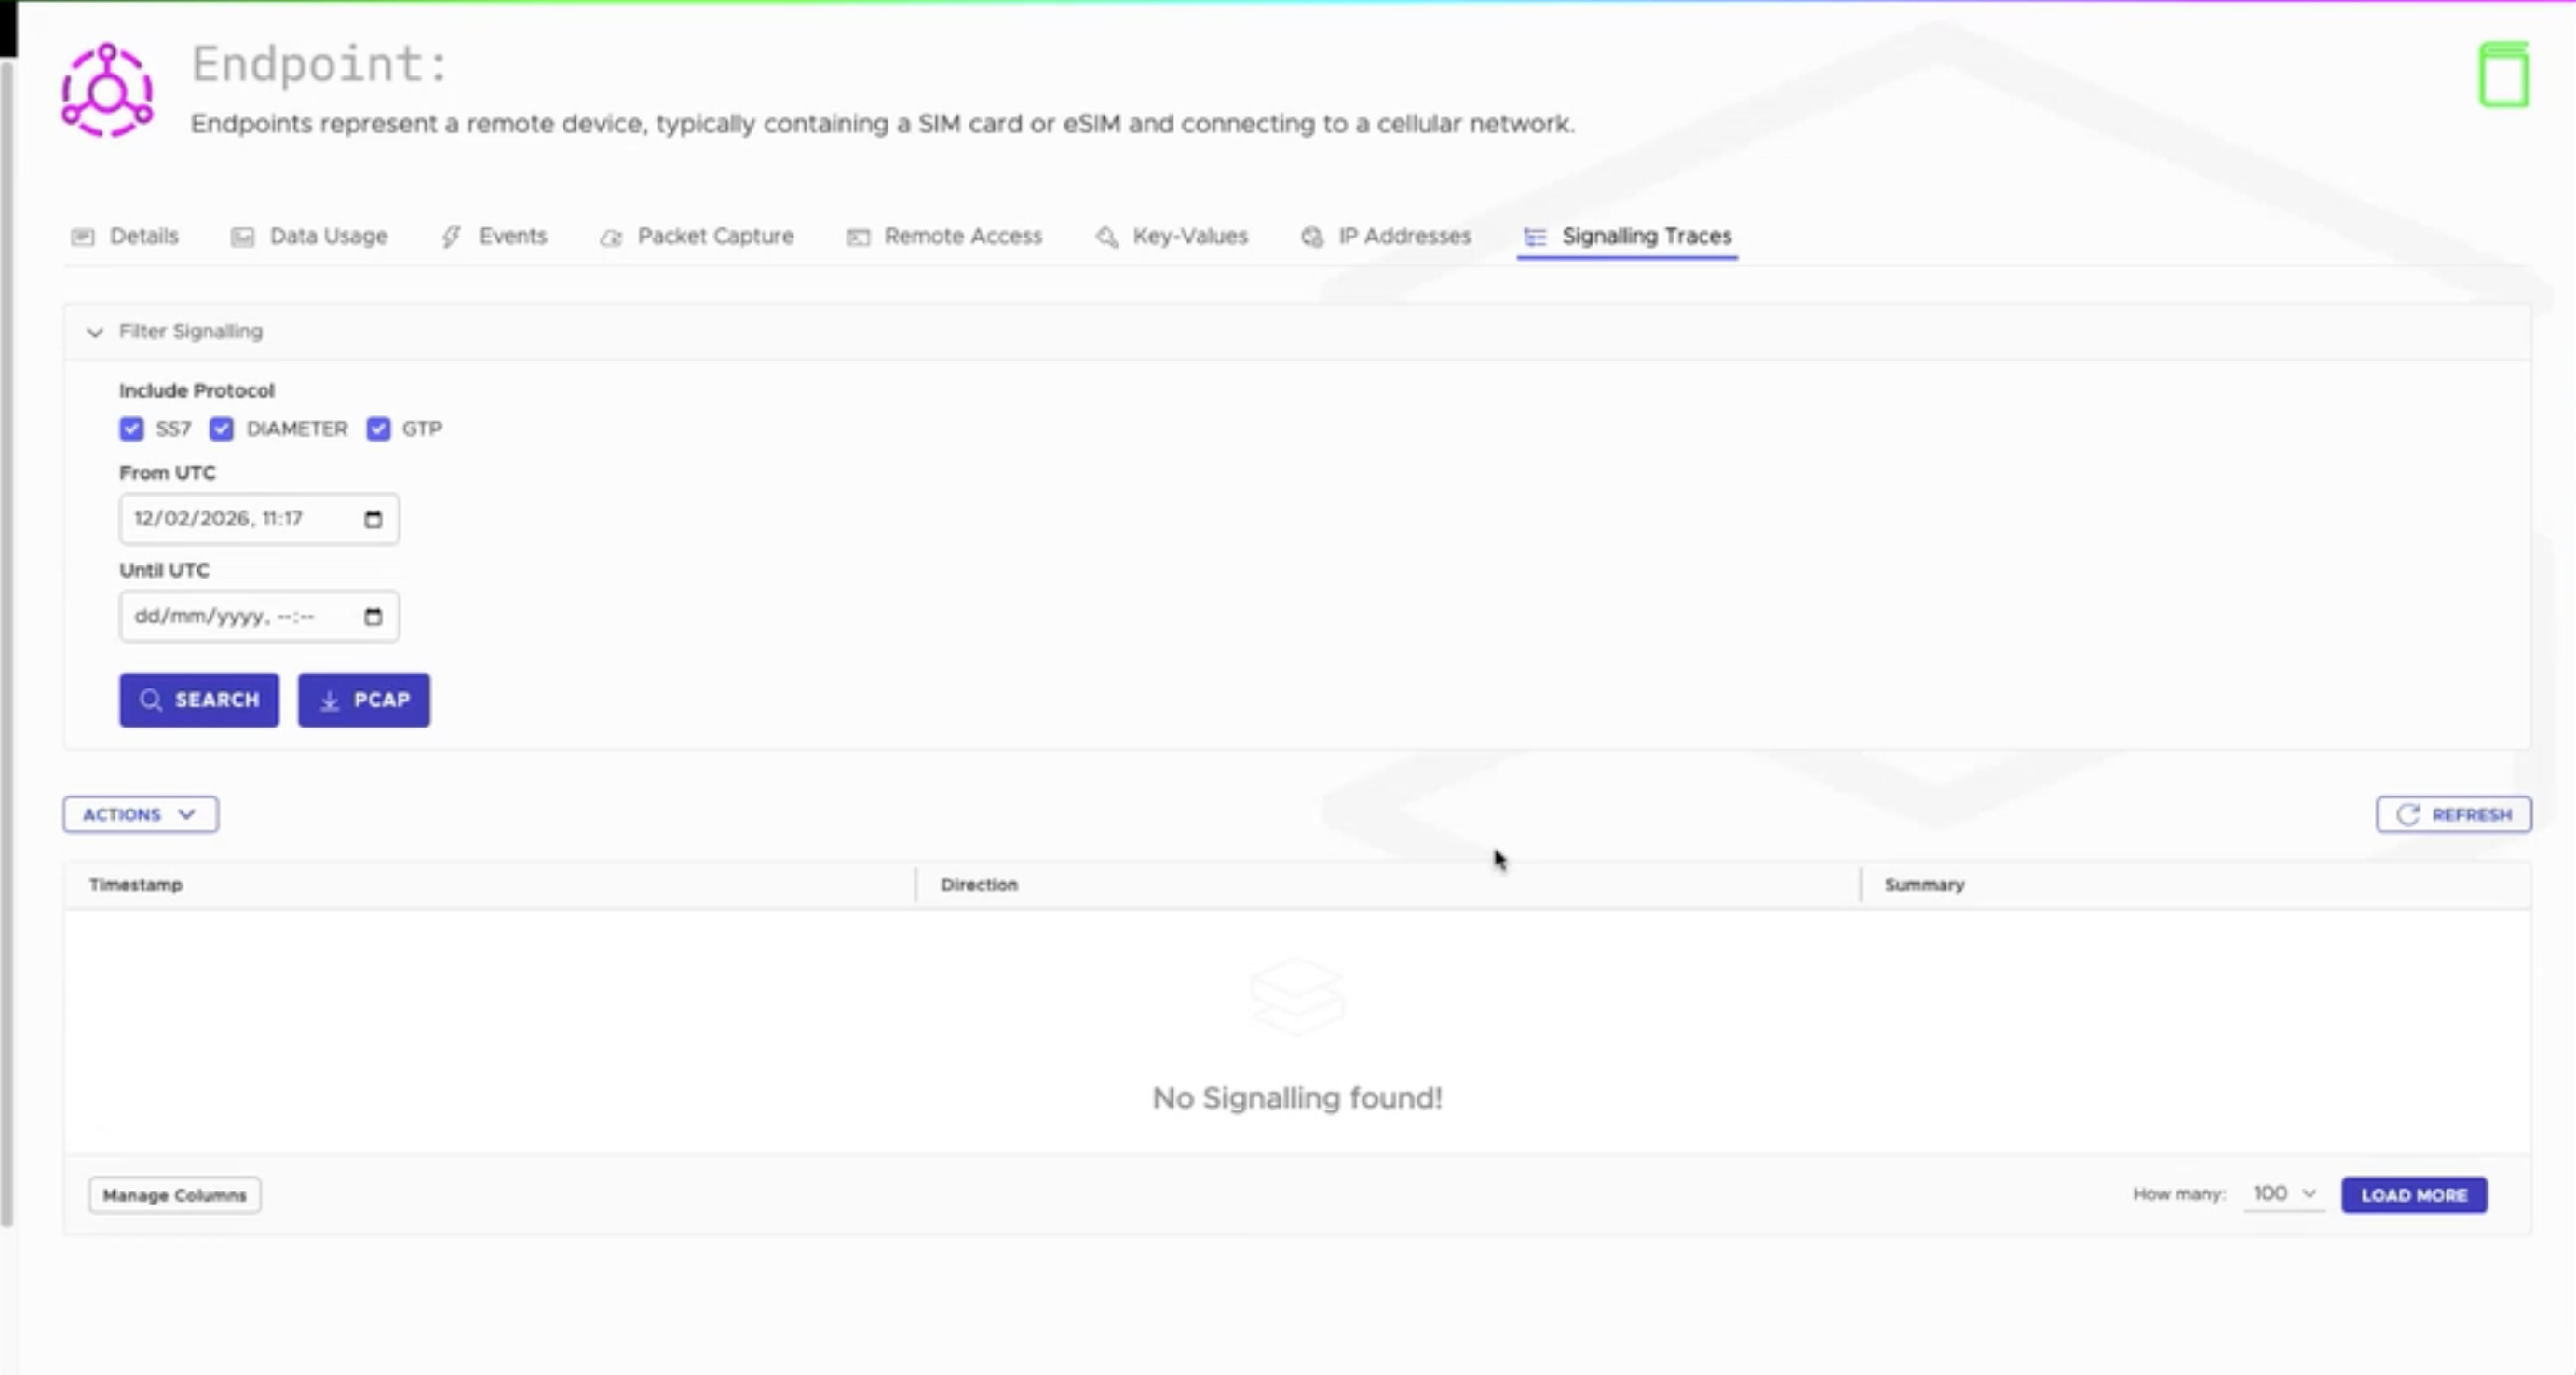
The Signalling Traces tab provides access to control-plane network signalling data for troubleshooting and analysis.
Note: Signalling Traces require a feature flag to be enabled for your account.
Availability and depth of signalling data may depend on your account type.
Accessing Signalling Traces
To view signalling traces for an endpoint:
- Navigate to Inventory → Endpoints
- Select an endpoint
- Open the Signalling Traces tab
What Are Signalling Traces?
Signalling traces show the underlying network activity associated with an endpoint’s connectivity.
They represent the control-plane interactions that occur when an endpoint:
- Connects to the network
- Authenticates with the network
- Creates or ends a data session
- Changes network state
These traces provide detailed insight into how the network is handling the endpoint.
Trace Display
The signalling traces view shows:
| Column | Description |
|---|---|
| Timestamp | When the signalling message was captured |
| Direction | Direction of the signalling message relative to the platform |
| Summary | A high-level description of the signalling activity |
Filtering
You can filter traces using:
- Protocol — Select which protocols to include (e.g. SS7, DIAMETER, GTP)
- From / Until (UTC) — Define the time range
Click Search to load results.
PCAP Export
The PCAP option allows you to download signalling trace data for offline analysis.
What is a PCAP File?
A PCAP file contains captured network data.
In this context, it contains signalling data for the selected filters and time range.
Exporting a PCAP File
To export signalling data:
- Apply the required filters
- Click PCAP
- Download the generated file
Viewing a PCAP File
PCAP files can be opened using tools such as:
- Wireshark
To view:
- Open Wireshark
- Load the downloaded file
- Inspect the signalling data
When to Use Signalling Traces
Use this view when:
- An endpoint is not connecting to the network
- A data session is not being created
- The endpoint is attaching but not behaving as expected
- Events do not provide enough detail
For traffic-level issues, use the Packet Capture tab.
Updated 4 months ago